YaliFunTome
Yarrowia lipolytica Functional Screens of Tanscription Factor-ome Database
YALI number: YALI0B00660g
Number: TF003 | Associated name: None | NCBI: 2907377 | RefSeq DNA: XM_500353.1 | RefSeq Peptide: XP_500353.1 | UniProtKB: Q6CG59
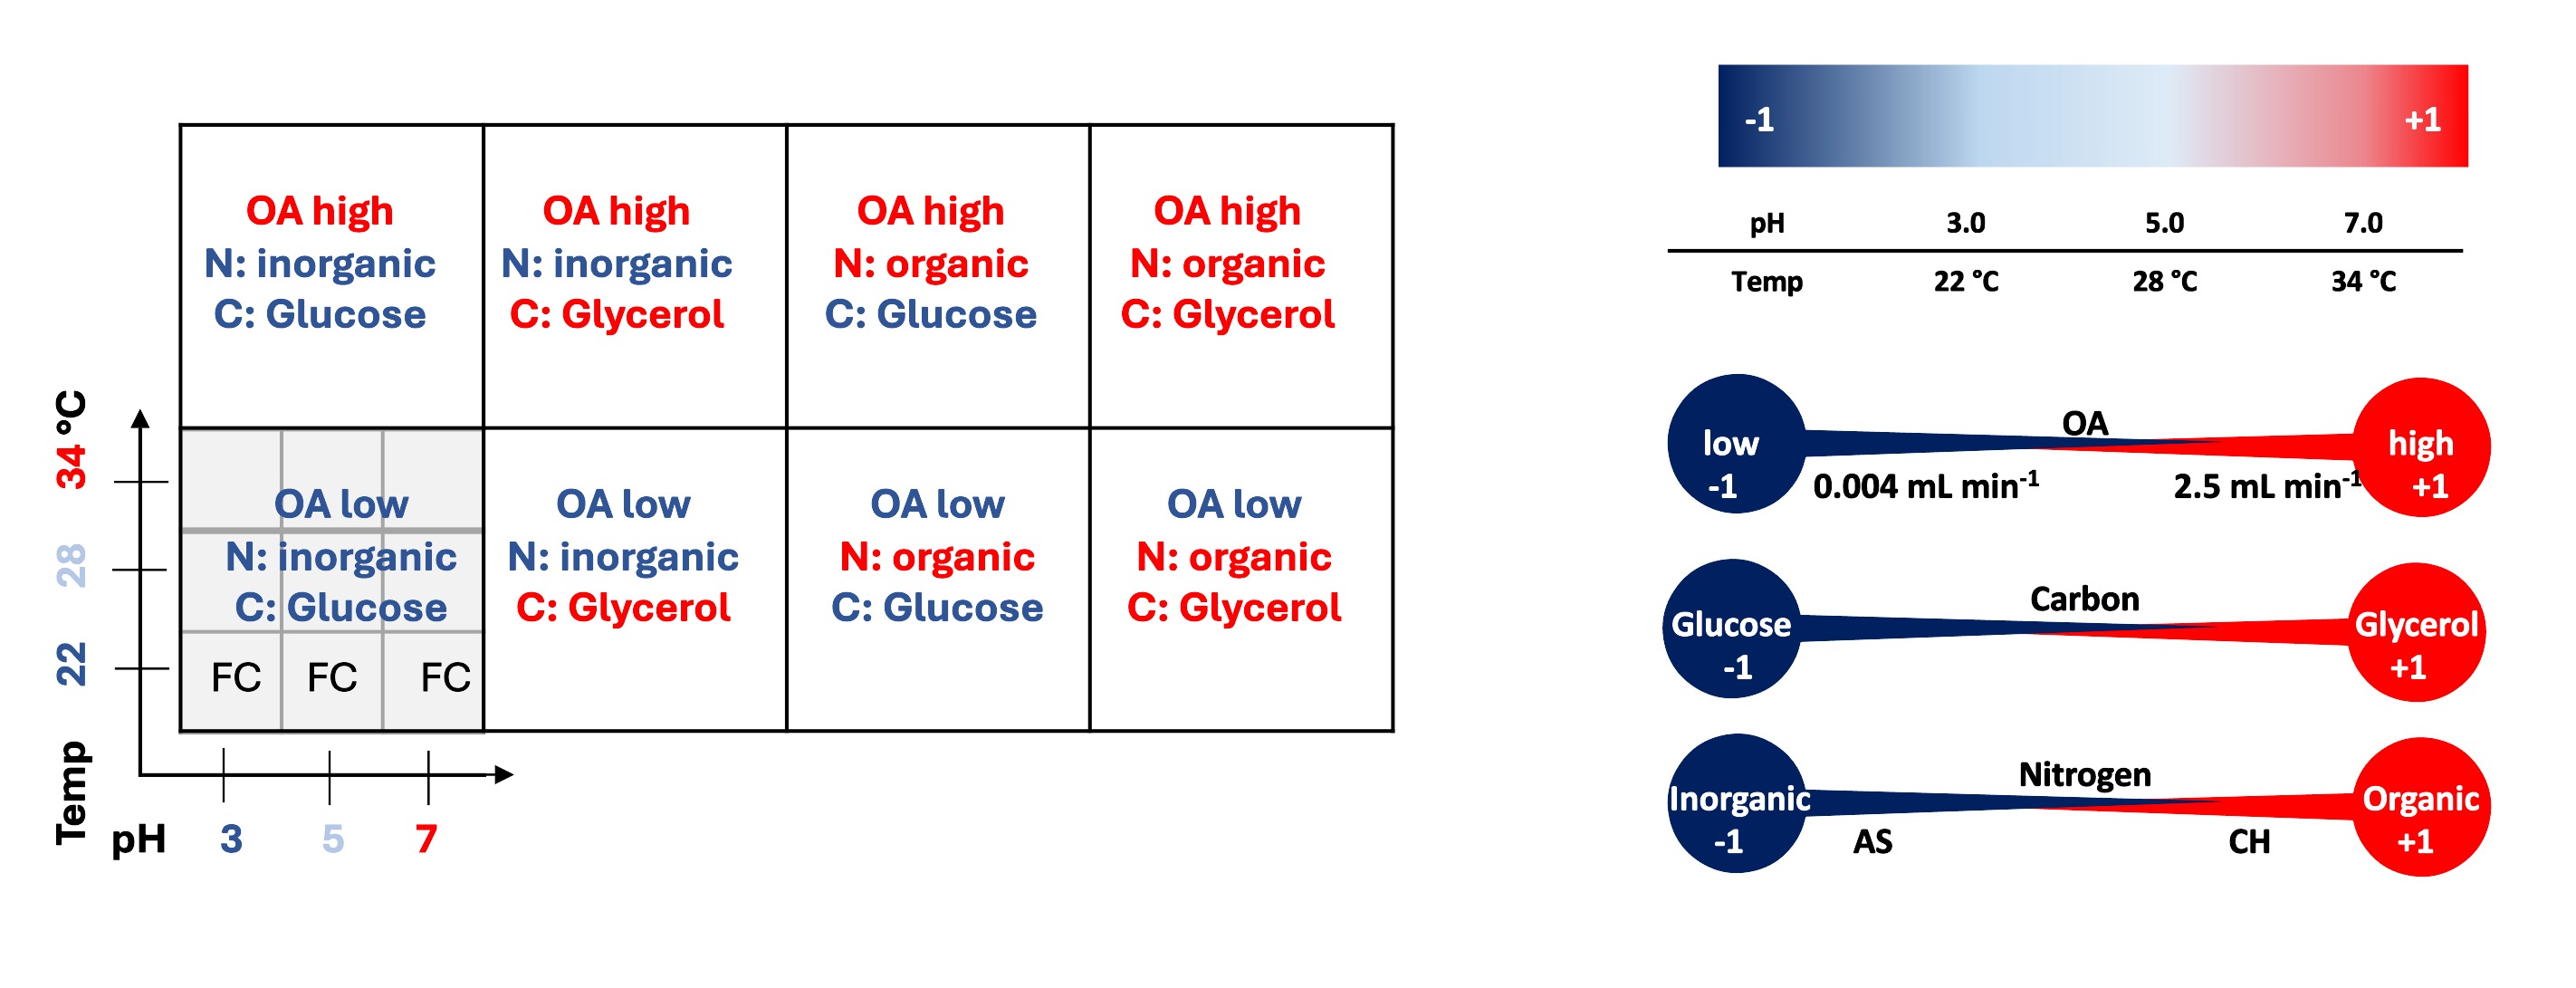
Fig.1. Graphical presentation of the arrangement of the variables' combinations corresponding to the data presentation scheme (left), and the variables' coding system (right). CH - casamino acid hydrolysate, AS - ammonium sulfate, OA- oxygen availability, FC - fold change of the response from the TF-OE strain over the control strain.
Legend:
FC - fold change over control strain, Sig - significant at p-value > 0.05, glu - glucose, gly - glycerol, i - inorganic, o - organic
| 2.0 | 1.7 | 1.5 | 1.3 | 1.1 | 1.0 | 0.7 | 0.5 | 0.3 | 0.1 |
Growth
Fold change in growth (optical density at 600 nm) of the TF-OE strain over the control strain
| 0.68 | ||
| 0.91 |
| 1.05 | ||
| 0.93 | 1.09 | |
| 0.97 | ||
| 0.95 | 1.23 | |
| 0.13 | ||
| 0.72 | 0.77 | 1.07 |
| 1.03 | ||
| 0.85 | 0.81 |
| 1.22 | ||
| 1.02 | 0.91 |
| 0.88 | 1.14 | |
| 0.95 | ||
Factor's Contribution
| YALI0B00660g |
|---|
| pH 11.22 |
| Nitrogen 2.22↔ |
| Carbon 0.33 |
| Temp -2.31 |
| OA -15.61 |
Total r-Prot
Fold change in fluorescence of r-Prot in the TF-OE strain over the control strain
| 0.57 | ||
| 0.76 |
| 1.18 | ||
| 1 | 0.99 | |
| 0.88 | ||
| 0.73 | 1.06 | |
| 0.23 | ||
| 0.95 | 0.72 | 0.74 |
| 0.89 | ||
| 0.89 | 0.93 |
| 1.3 | ||
| 0.96 | 0.86 |
| 0.94 | 0.88 | |
| 0.88 | ||
Factor's Contribution
| YALI0B00660g |
|---|
| pH 10.41 |
| Temp -2.86 |
| OA -18.17 |
| Nitrogen non-significant |
| Carbon non-significant |
Normalized r-Prot
Fold change in fluorescence of r-Prot normalized per biomass in the TF-OE strain over the control strain
| 0.93 |
| 0.95 |
| 0.97 | ||
| 1.13 | 0.89 | |
| 1.03 | 0.98 | 0.82 |
| 1.1 | ||
| 0.98 | ||
| 1.23 |
| 0.87 | ||
| 0.94 |
| 0.79 | ||
| 1.04 | ||
| 0.87 | ||
| 0.98 | 0.72 | |
| 0.77 | ||
| 0.96 | ||
| 2.34 |
Factor's Contribution
| YALI0B00660g |
|---|
| pH 2.96 |
| Carbon 1.76↔ |
| Nitrogen 0.48 |
| Temp -19.97 |
| OA non-significant |