YaliFunTome
Yarrowia lipolytica Functional Screens of Tanscription Factor-ome Database
Data presentation
The TF co-OE strains were cultured under a combination of environmental variables which is schematically presented below. The data presentation scheme corresponds to the arrangement of conditions shown in Fig.1:
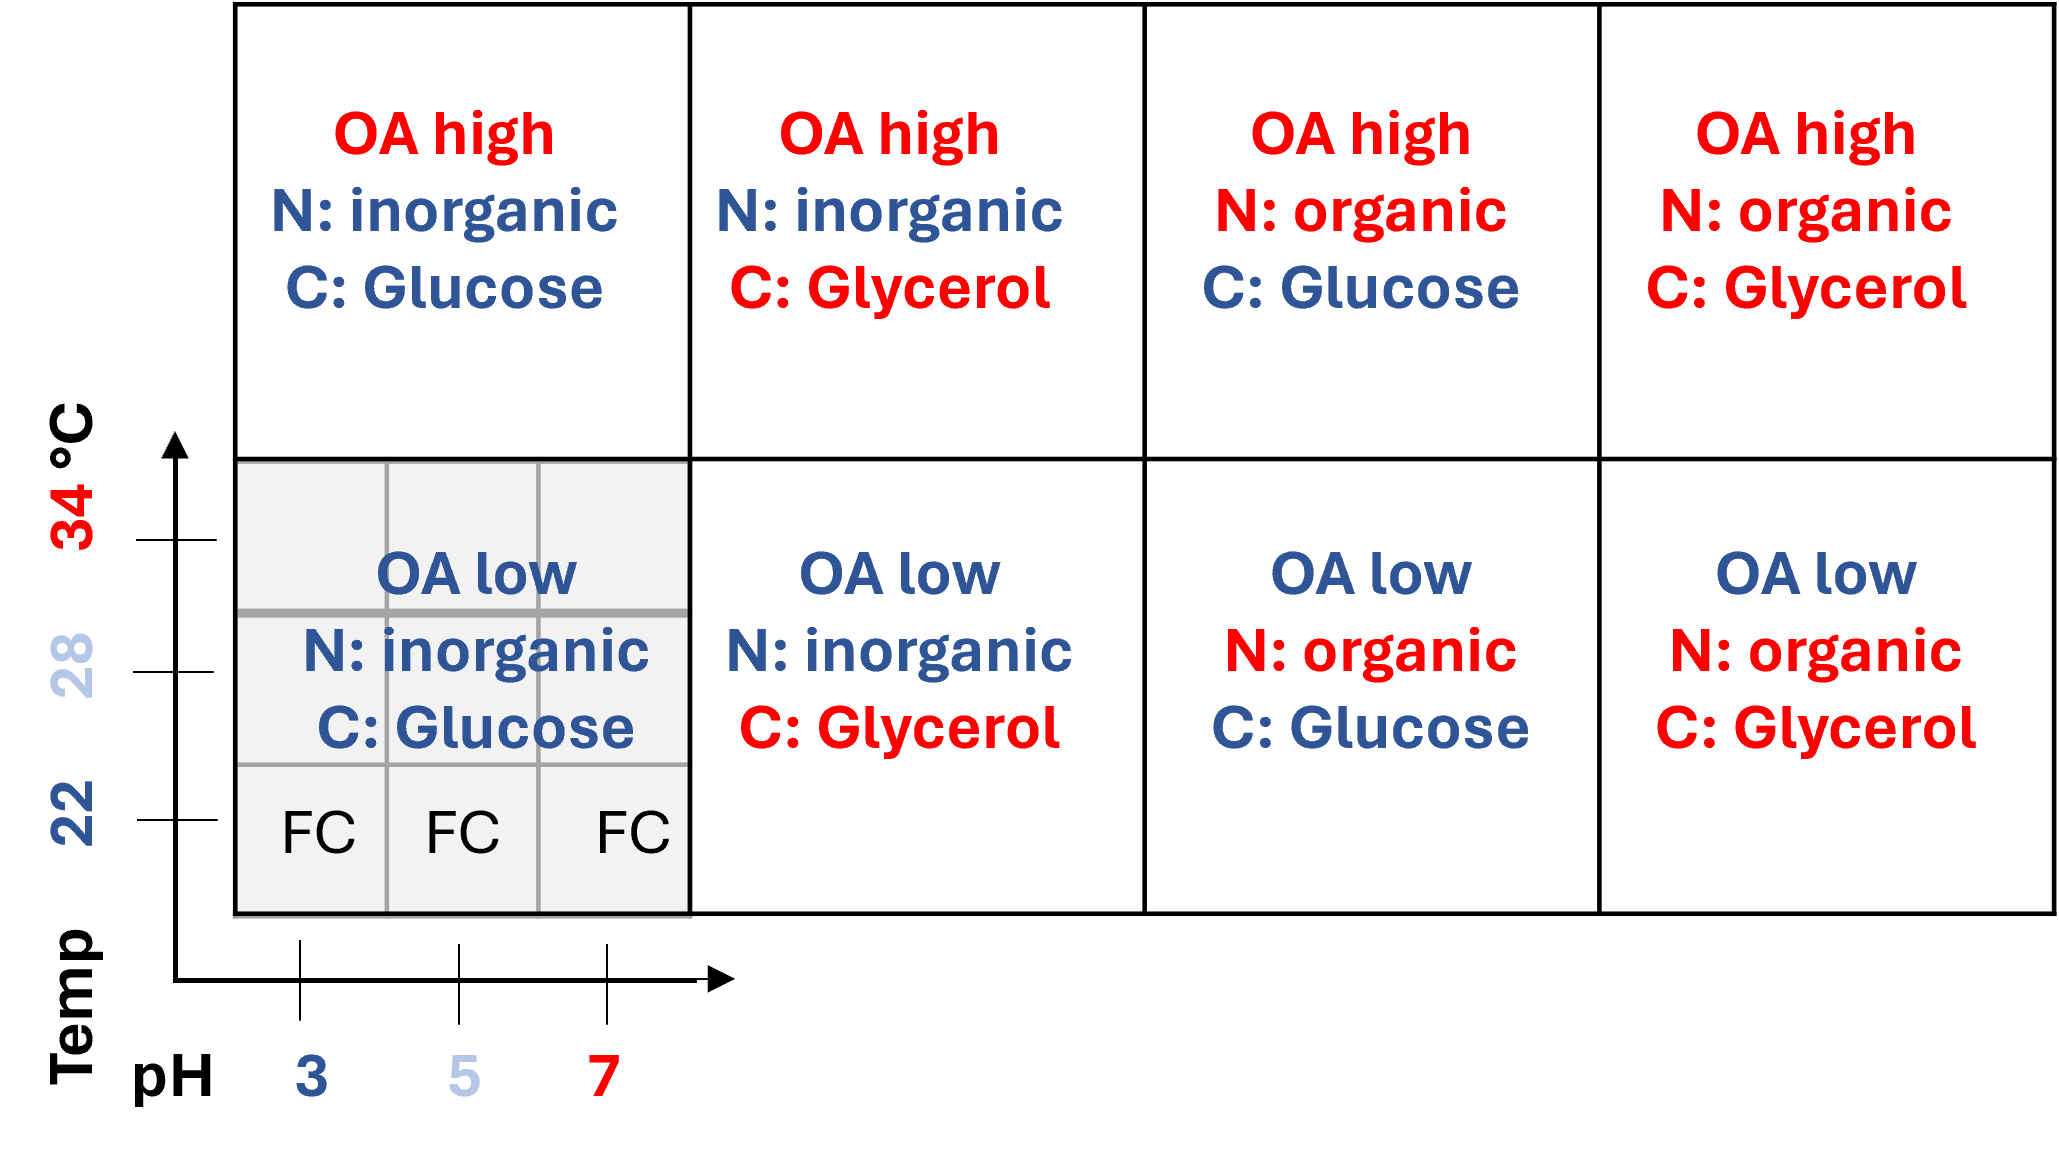
Fig.1. Schematic representation of the variables combinations - corresponding to the data presentation scheme.
Each strain overexpressing an individual TF (TF-OE strain) was tested under an array of conditions, and so was the reference strain. Raw data for:
- optical density at 600 nm wavelength as a proxy of growth,
- fluorescence intensity from a reporter protein as a proxy of r-Prot synthesis,
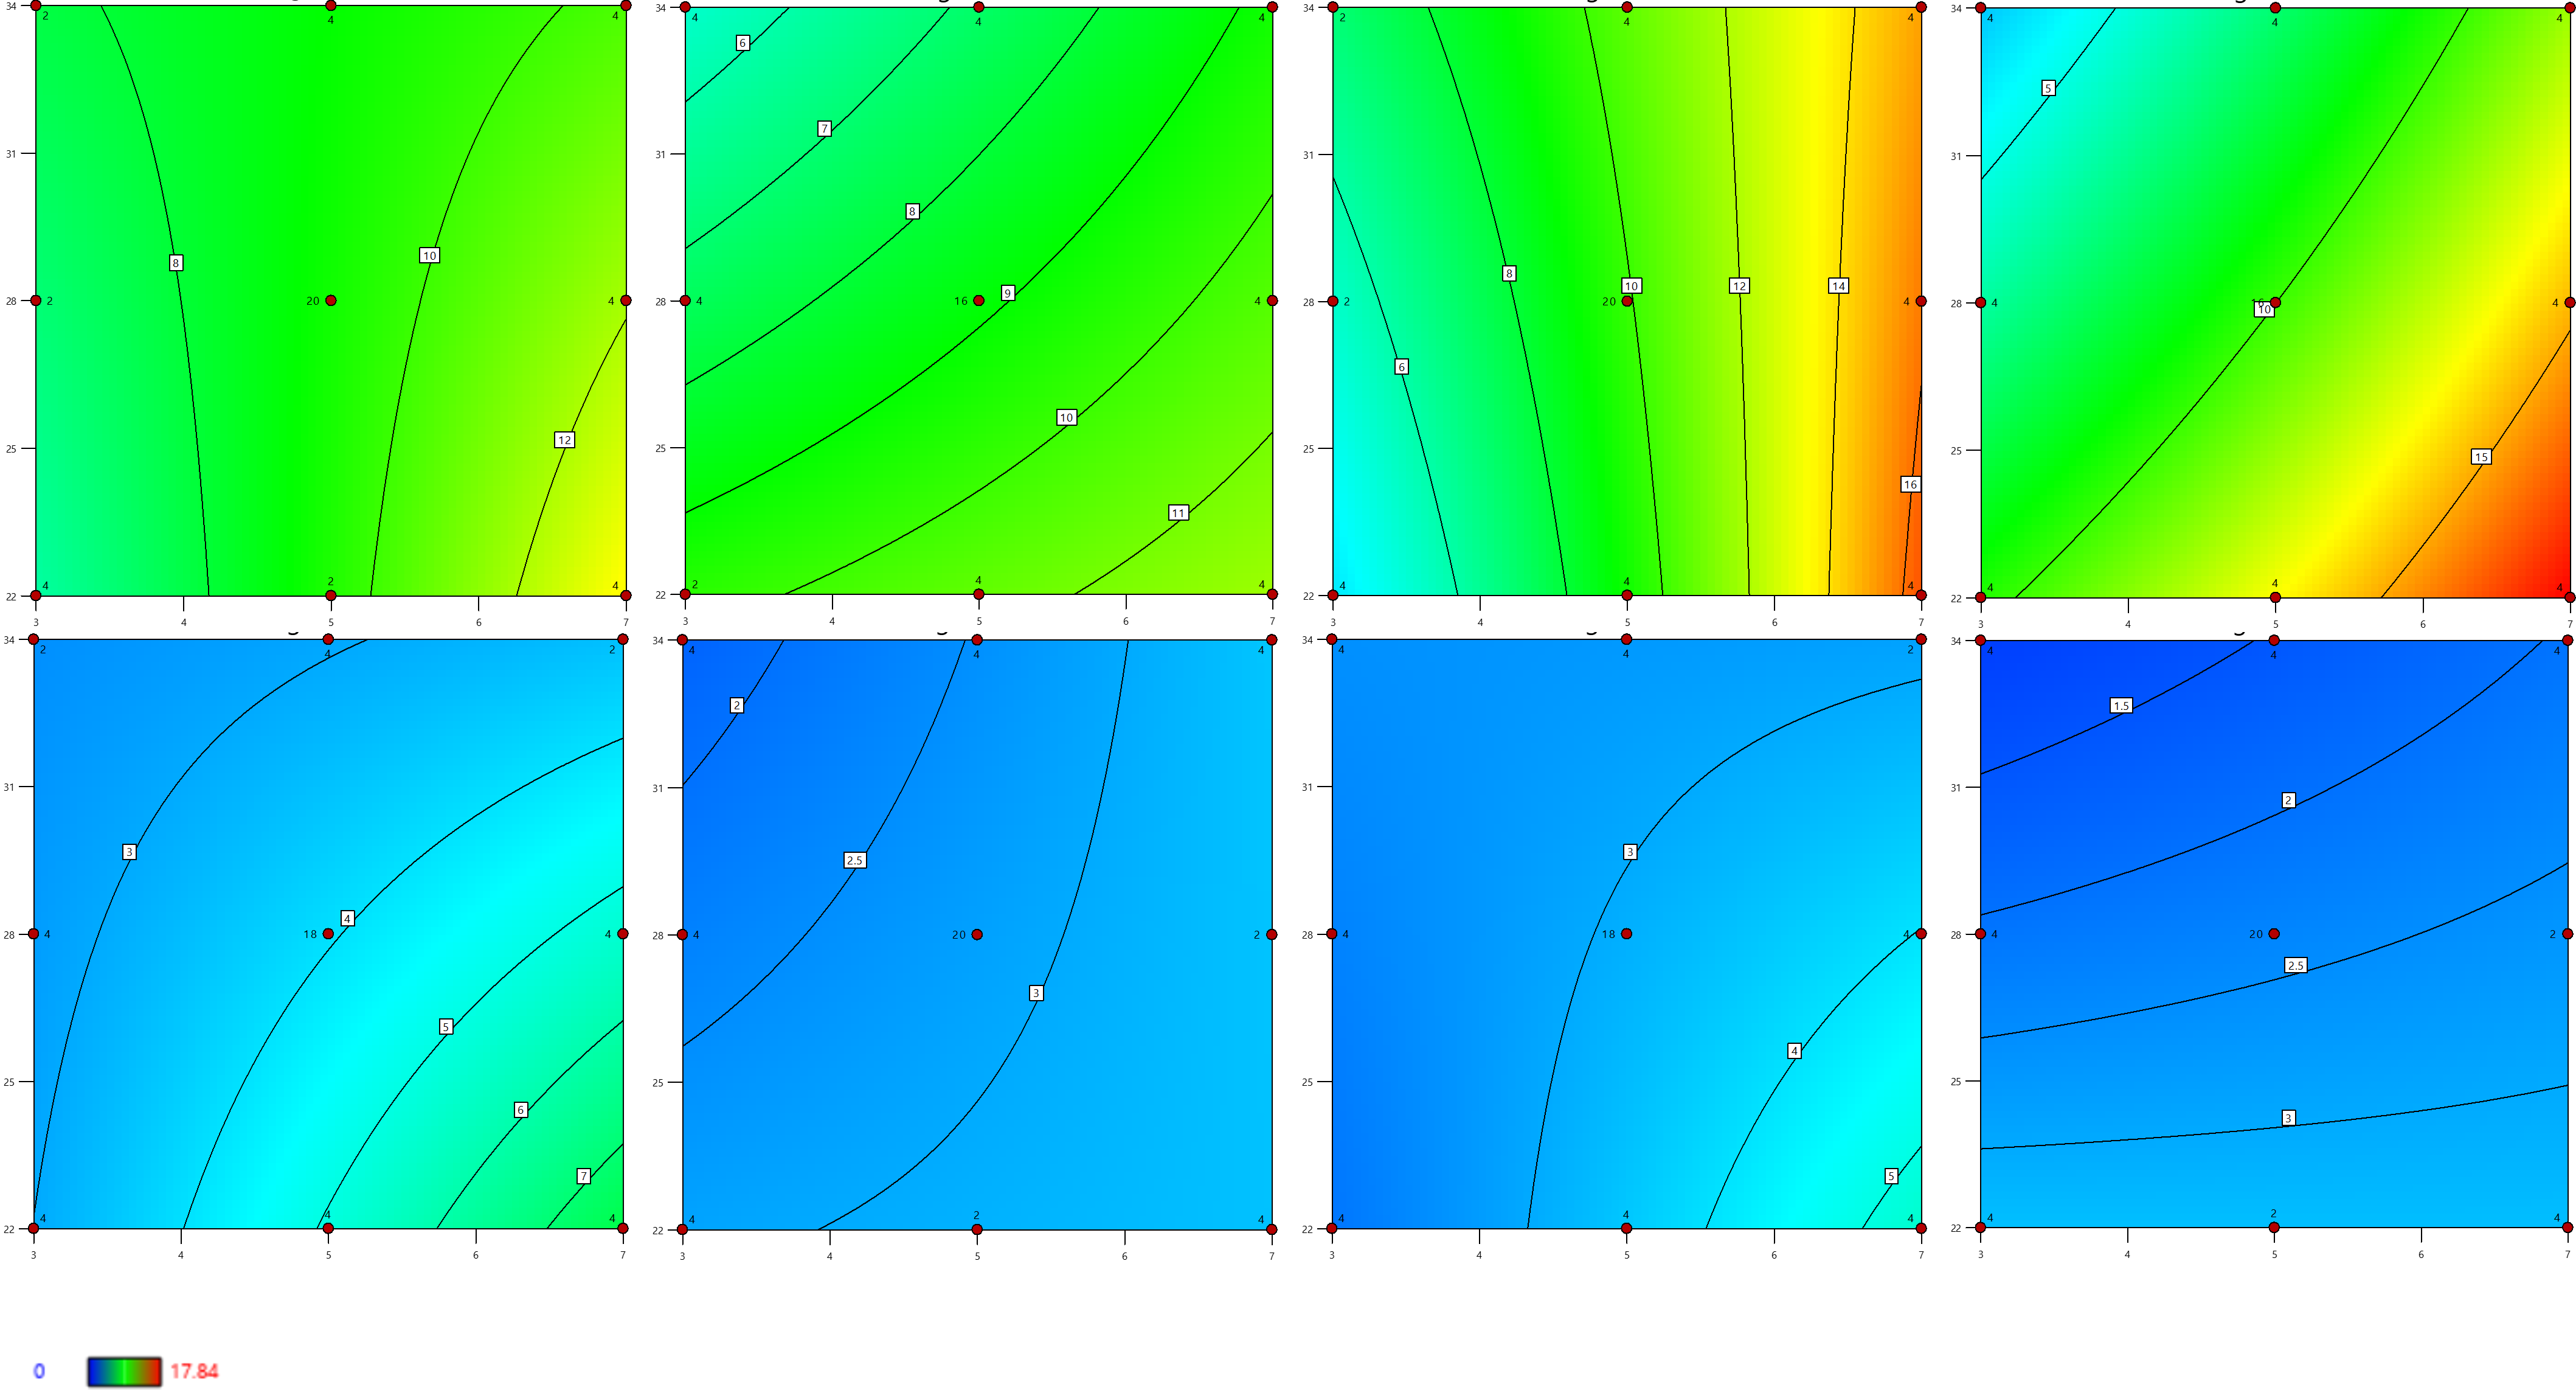
Fig.2. Set of graphs representing Response Surface Models of a single read parameter (growth in this example) under an array of variables combinations - arrangement of the graphs corresponds to Fig.1. Schematic representation of the combinations of the variables.
The final results are presented as heat-maps (Fig.3) of fold change (FC) of a given measure response in the TF-OE strain over the control strain.
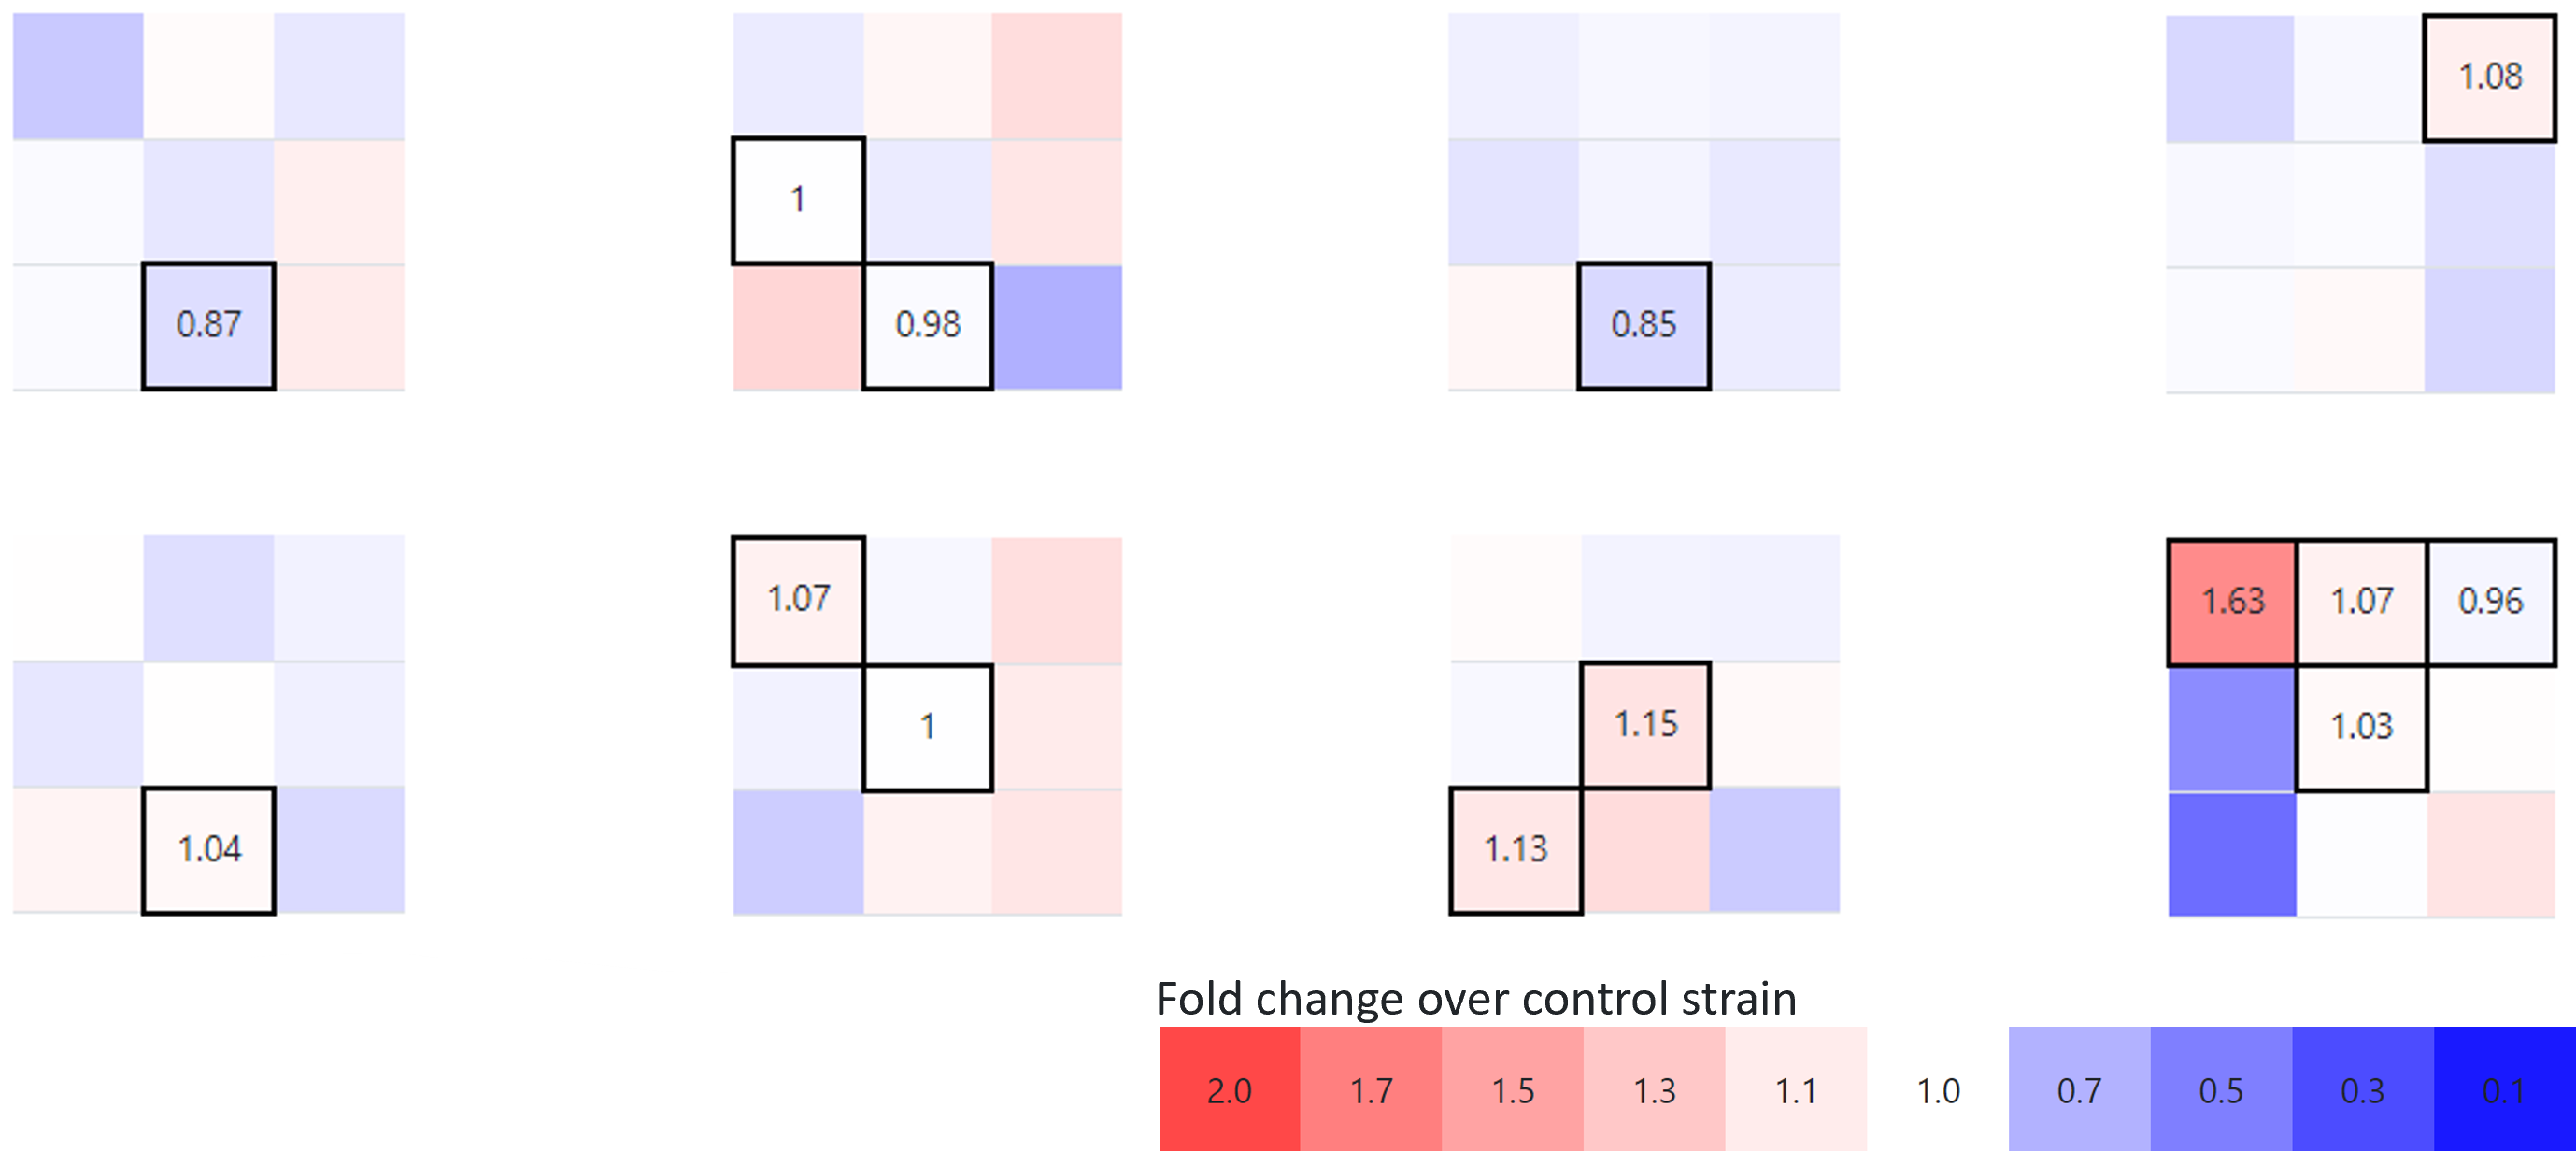
Fig.3. Heat map indicating Fold Change in a given parameter (growth / r-Prot / normalized r-Prot) for a specific TF-OE strain over the control strain under a specific combination of the variables; arrangement corresponds to the experimental setup scheme.
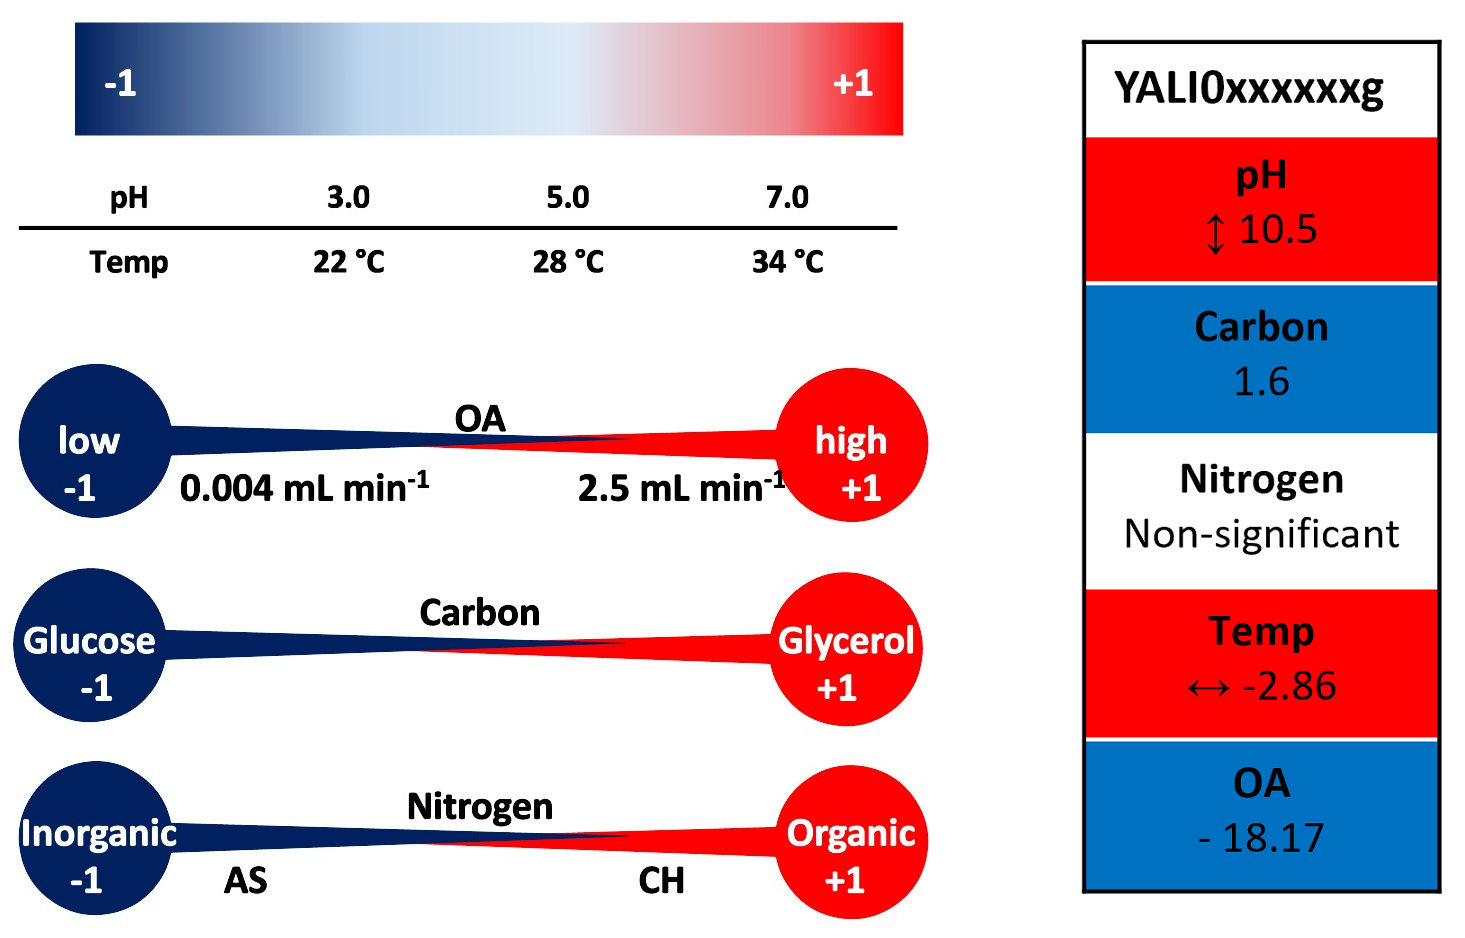
The adopted data processing strategy enabled the evaluation of each specific variable's contribution to the response's variability (growth, amount of r-Prot) elicited by a given TF-OE strain. This evaluation is presented in Factor's Contribution tables indicating the dominant level of a variable (color-coded and as +1 or -1, according to the adopted coding system) and a percentage contribution of the variable to the response. Exemplary data showing the ranking of variables' contribution to the analyzed response is shown in Fig.4. with a reminder of the variables' coding system.
- ■ and contribution % value > 0: dominant level +1, variable's contribution higher than in the control strain
- ■ and contribution % value < 0: dominant level +1, variable's contribution lower than in the control strain
- ■ and contribution % value > 0: dominant level -1, variable's contribution higher than in the control strain
- ■ and contribution % value < 0: dominant level -1, variable's contribution lower than in the control strain
- □ non-significant contribution of the variable's
- ↕ impact inversion: the preferred level of the variable is opposite in the control strain
- ↔ impact gain: impact is non-significant in the control strain, and gained significance in the TF-OE strain
Fig.4. Graphical presentation of the variables' coding system and Exemplary Factor's Contribution ranking with a legend. The coding system corresponds to Tab.1 in experimental setup CH- casamino acid hydrolysate, AS - ammonium sulfate, OA- oxygen availability.
The rankings are prepared based on Response Surface Models (Fig.2 in data presentation ). Each ranking represents variable's contribution to a response of a given read parameter (growth / r-Prot / normalized r-Prot) elicited by a specific TF-OE strain.