YaliFunTome
Yarrowia lipolytica Functional Screens of Tanscription Factor-ome Database
Control strain
The control strain used in this study is a completely prototrophic strain over-expressing solely the reporter protein (RedStar2) maintained under the same conditions as the co-OE TF strains under study. All the data presented in the database are expressed as fold change (FC) of a given measure over the reference strains.
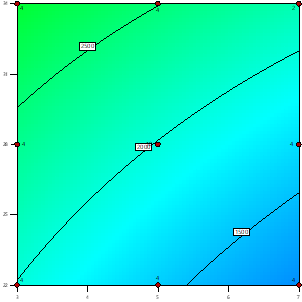
Response surface models for growth, total r-Prot, and normalized r-Prot amounts for the control strain are presented below, together with Factor's Contribution tables indicating the dominant level of a variable and a percentage contribution of the variable to a given response.
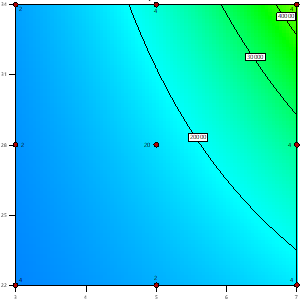
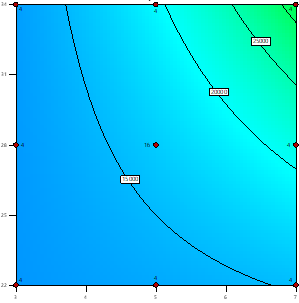
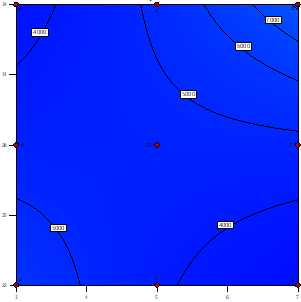
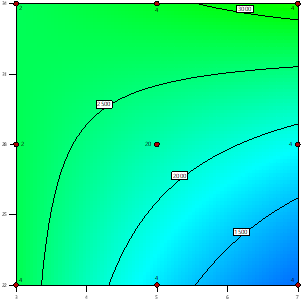
Growth
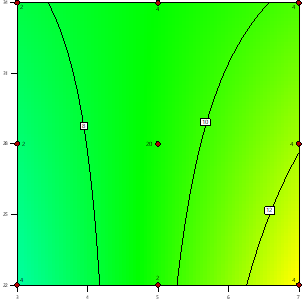
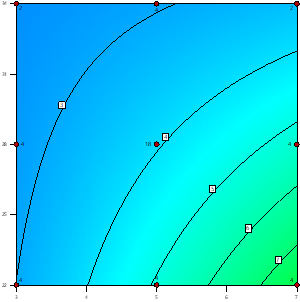
Factor's Contribution
| Control strain |
|---|
| OA 53.2 |
| pH 12.5 |
| Temp 3.3 |
| Carbon 0.6 |
| Nitrogen Non-significant |
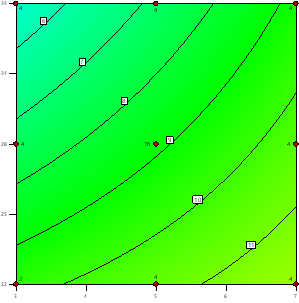
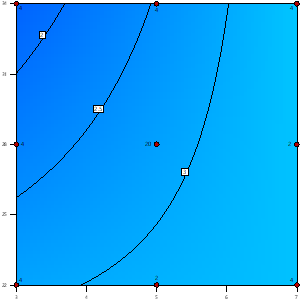
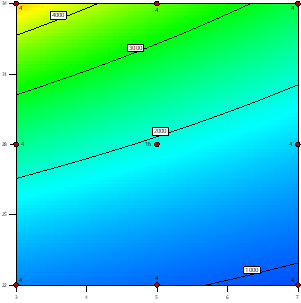
Total r-Prot
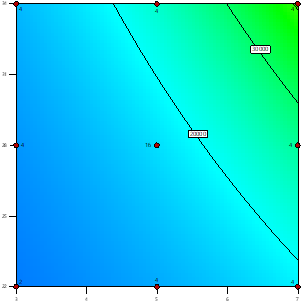
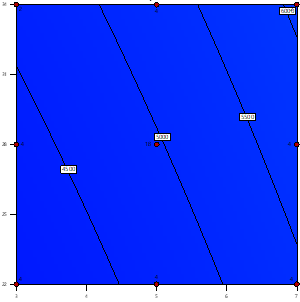
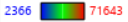
Factor's Contribution
| Control strain |
|---|
| OA 70.1 |
| pH 4.6 |
| Temp 4.5 |
| Carbon 1.0 |
| Nitrogen 0.3 |
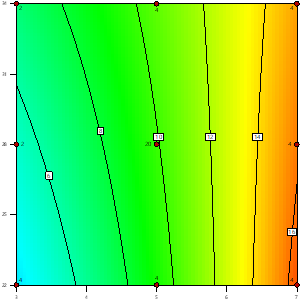
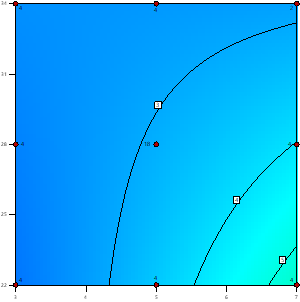
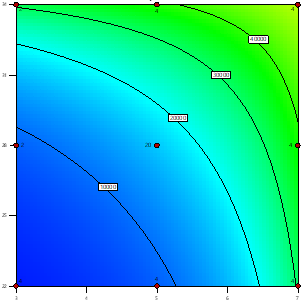
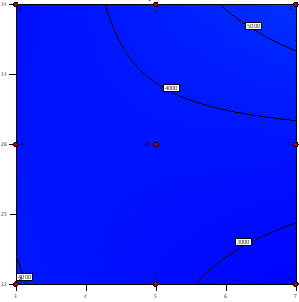
Normalized r-Prot
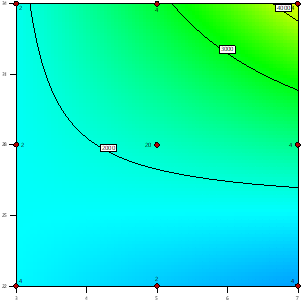
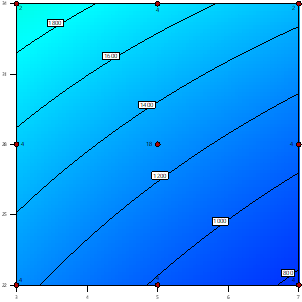
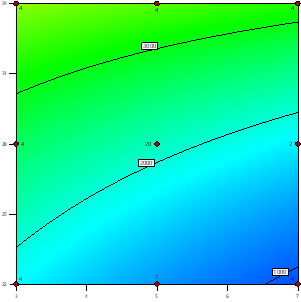
Factor's Contribution
| Control strain |
|---|
| Temp 40.5 |
| pH 3.9 |
| OA 3.7 |
| Nitrogen 3.6 |
| Carbon Non-significant |
These graphics present how the reference strain responded in terms of growth, total r-Prot and normalized r-Prot amounts when subjected to an array of conditions experimental setup. The Factor's Contribution tables show which variables significantly contributed to the given response, and the extent of this contribution, according to a convention presented here: data presentation.